Student R&D · Applied ML · Market Sentiment
Financial trend forecasting leveraging sentiment analysis.
A student research project exploring how traditional indicators, SEC filings, news sentiment, and deep learning architectures can work together to predict stock price movements and inform algorithmic trading strategies.
Objective
The goal of this student-led project was to build a forecasting pipeline predicting next-day closing prices for selected equities. By combining structured price data, engineered financial indicators, and sentiment extracted from public disclosures and news, we aimed to understand how narrative signals influence traditional quantitative models.
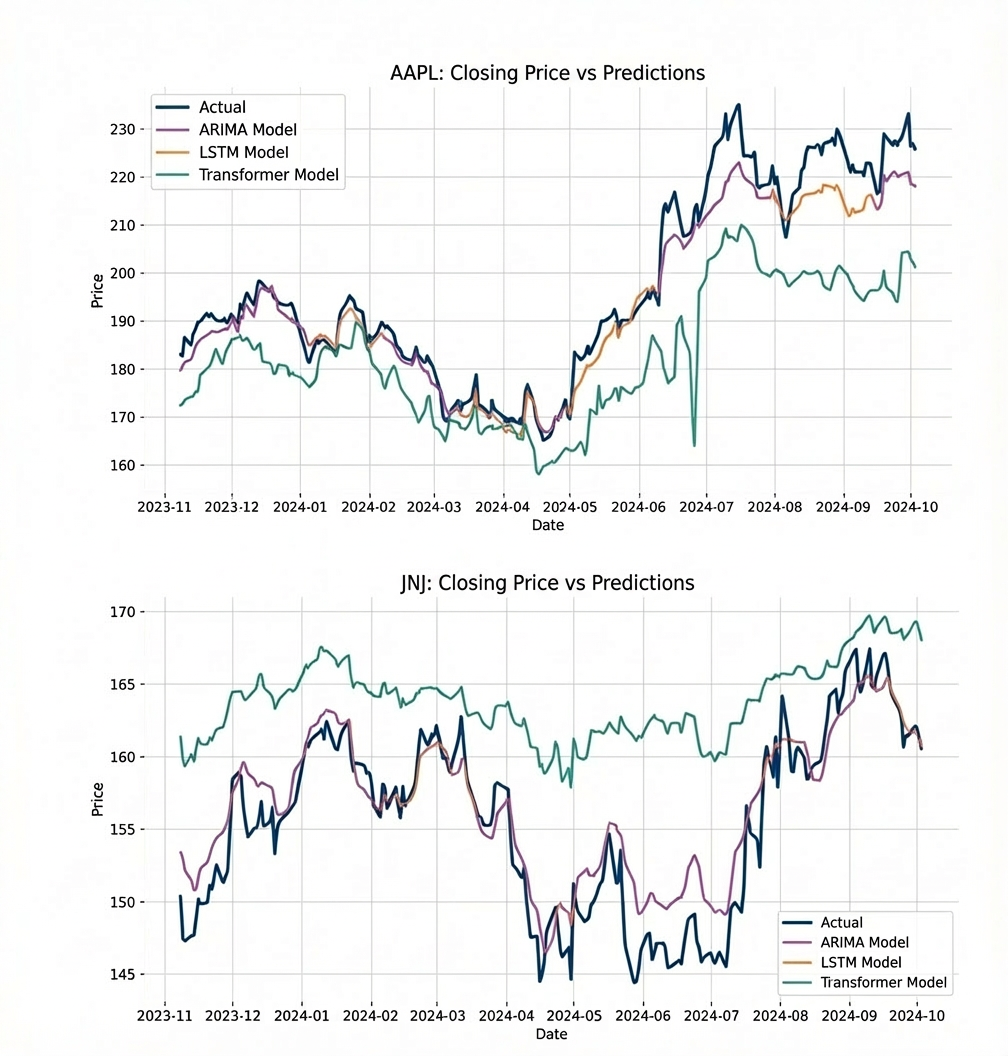
The work compares three families of models—ARIMA, LSTM, and Transformer—on identical datasets, evaluating them with MAE, MSE, RMSE, R², residuals, and simulated cumulative returns for basic trading heuristics.
Assets & horizon
Daily OHLCV data is combined with hand-built technical indicators and sentiment scores from SEC filings and news headlines.
Each timestep in the training sequences includes:
- • Normalized price and volume
- • SMA, EMA, MACD, RSI, Bollinger bands, and stochastic oscillators
- • SEC sentiment score (interpolated for non-filing days)
- • News sentiment score from up to five headlines
Feature snapshot
Example features fed into the sequence models:
SMA(20), EMA(20)
MACD & signal line
RSI(14)
Stochastic %K, %D
Bollinger band width
Log returns
News sentiment score
SEC sentiment score
Models
Three architectures are treated as next-day regressors (no classification). Training, validation, and test splits are strictly chronological to respect time-series ordering.
ARIMA baseline
Classic ARIMA on closing prices only. Provides a smooth baseline but fails to react to regime changes and sentiment shifts.
Transformer regressor
A lightweight Transformer with positional embeddings over 5-day windows. It captures some temporal structure but is more sensitive to noise.
LSTM sequence model
A stacked LSTM with dropout and Adam optimization. After tuning, it delivers the best fit on both assets, with R² around 0.93 for AAPL and 0.85 for JNJ.
Results
On both AAPL and JNJ, the LSTM tracks the trend and local swings much more closely than ARIMA. ARIMA behaves like a slowly drifting line, while the LSTM learns to follow rallies, drawdowns, and sideways ranges.
The gap between the two curves is largest around sharp moves—earnings, macro news, or sector shocks—where sentiment features give the LSTM extra signal that ARIMA never sees.
Cumulative returns from a simple strategy using model forecasts versus actual returns, highlighting where learned models can add value vs. naive baselines.
Classroom R&D that led to a sentiment analysis system.
What started as a student research initiative had evolved into a working prototype for sentiment-aware forecasting.